Add displays to your Bot
This page explains how to add displays to the workflow so that they appear when the user opens the results of their workflow run.
1. The different displays
There are four displays that you can add to your workflow.
This needs custom implementation in your class, for more information see
the display section.
- Markdown: This can be used to present what the bot does or to present the results in text format.
- MultiPlot: This allows the representation of the relationship between data on your object. The MultiPlot block is the one which does not need any custom implementation (generic block).
- Plot_data: This allows the representation of an object in 2D view, and also
can be used to represent the relationship between data on your object (like
MultiPlot). The
Plot_Datablock is the one which need to decorate the custom method. - Cadview: This allows the representation of an object in 3D format.
2. How to add displays to your bot
-
First, you have to implement your fonction in your object (e.g. 2D plot) or volmdlr_primitives for CAD in your code.
-
After coding your functions, you can add blocks to your workflow that allow you to read these functions.
-
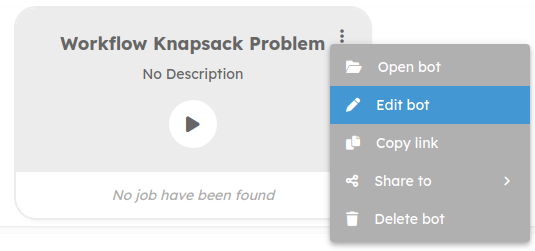
By clicking on the three dots of the workflow identification card, you can open a small modal page and then click on
Editto modify your workflow and add display blocks.
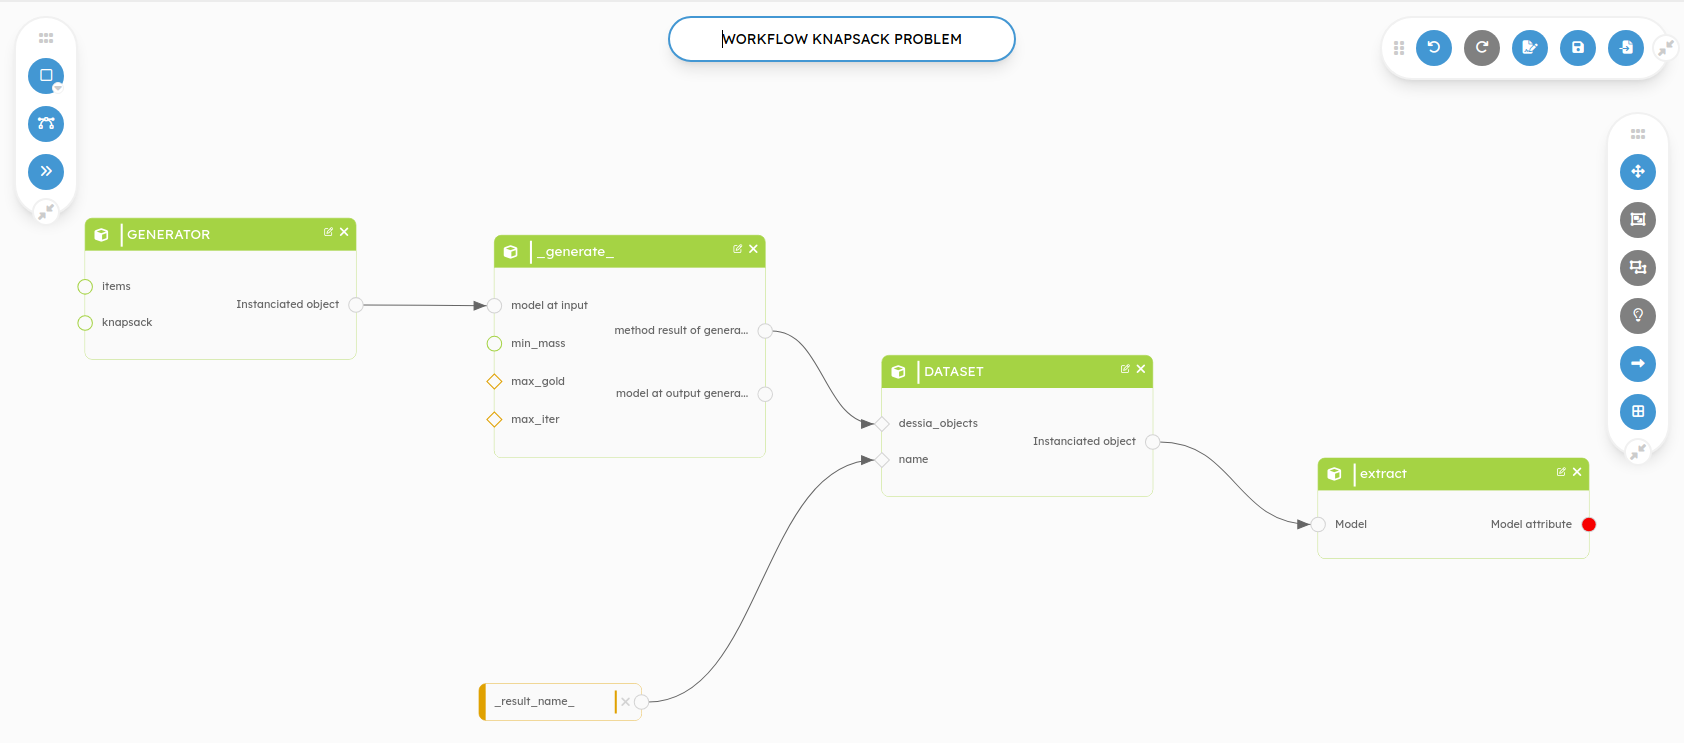
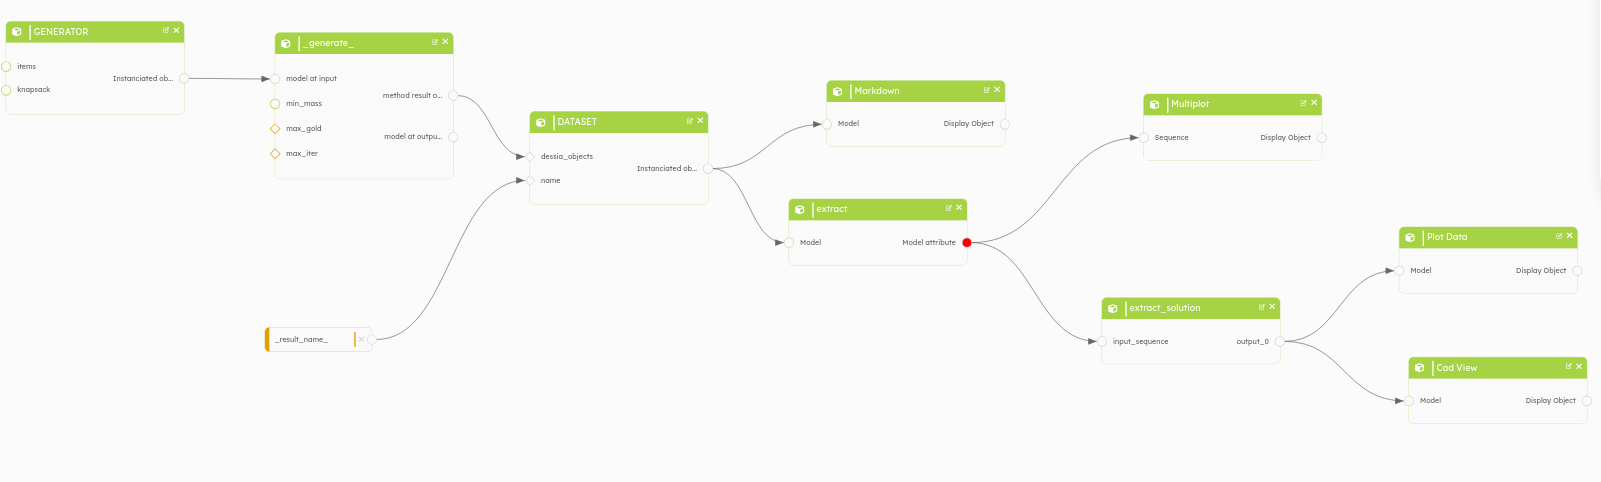
- By clicking on Edit, you will be redirected to the page where you can edit your workflow. In this example, we see our workflow with different blocks (methods, class) and we will add display blocks.
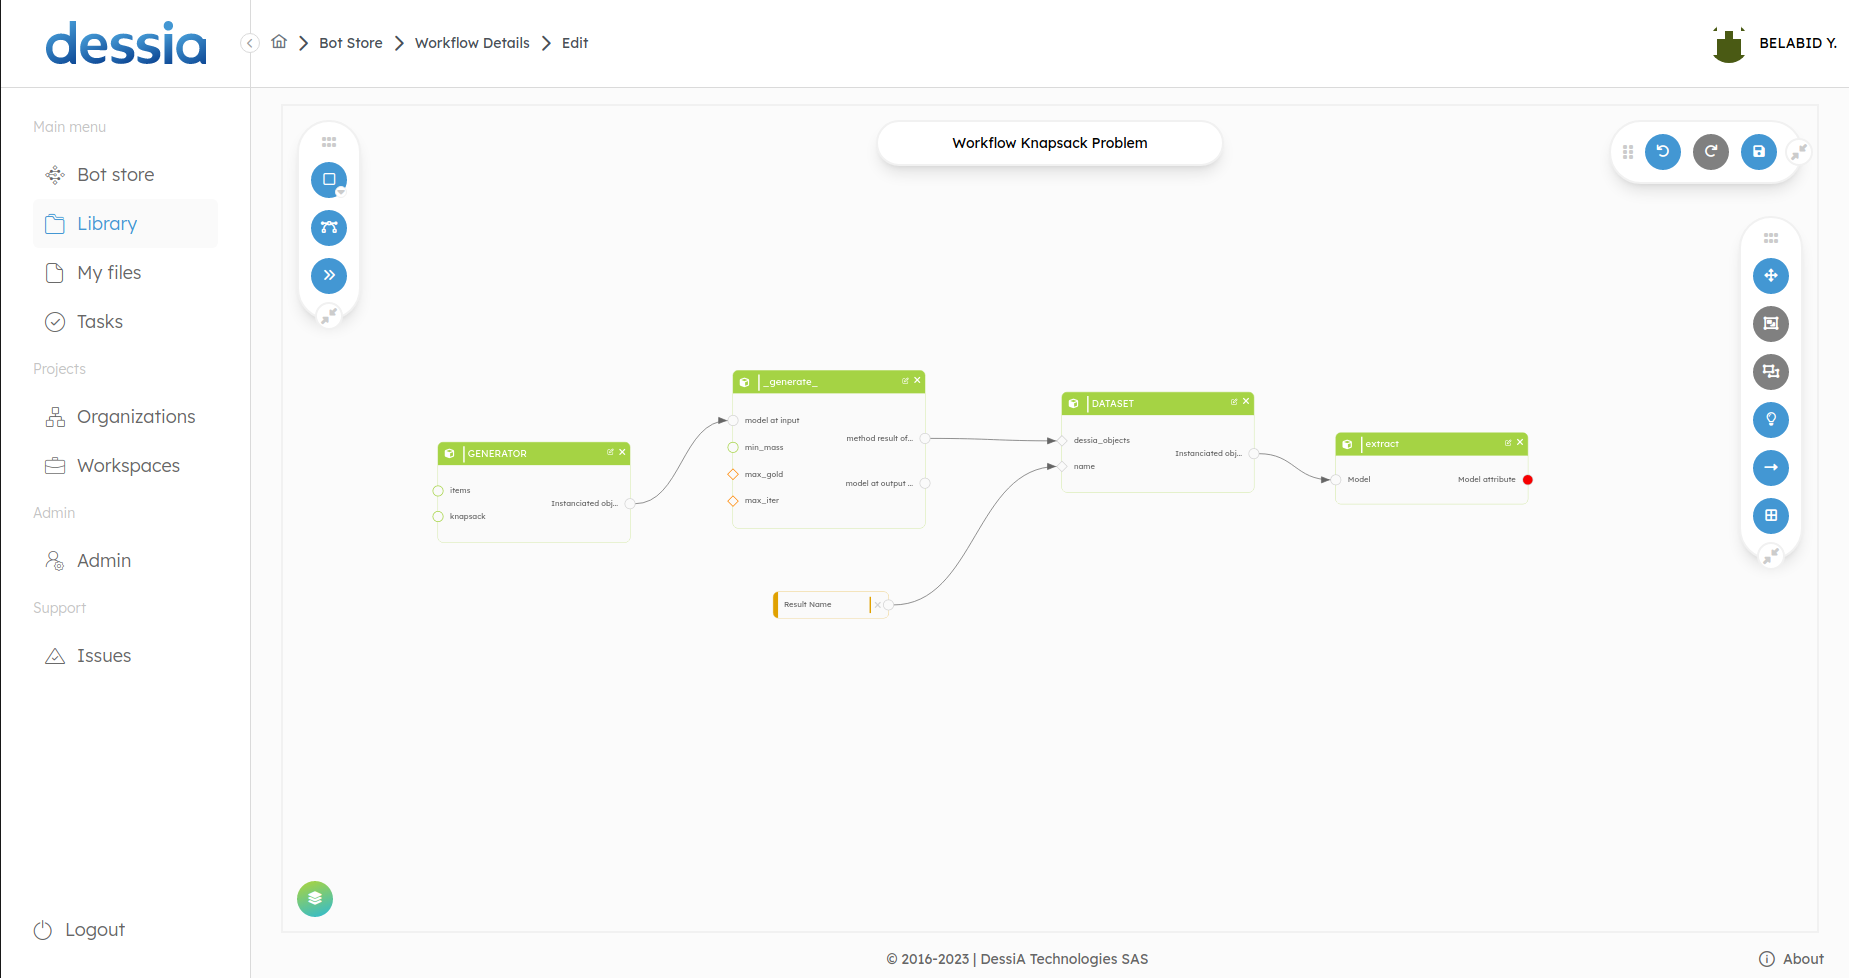
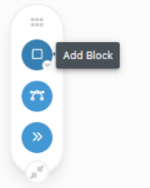
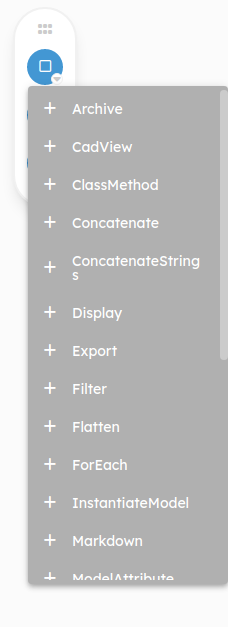
- To add a block, click on the "Add Block" button. This will open a drop-down menu where you can select the type of block to add.
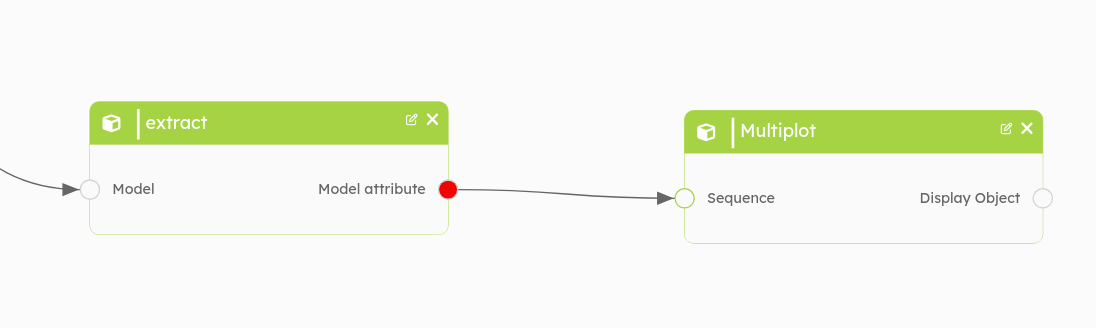
In this example, we will present the instantiation of the four blocks of
displays presented above. Before that, we will talk about the output results
and the workflow. At the output, we have a list of objects represented by
the block named extract, as we can see with the red dot at the output of
this block.
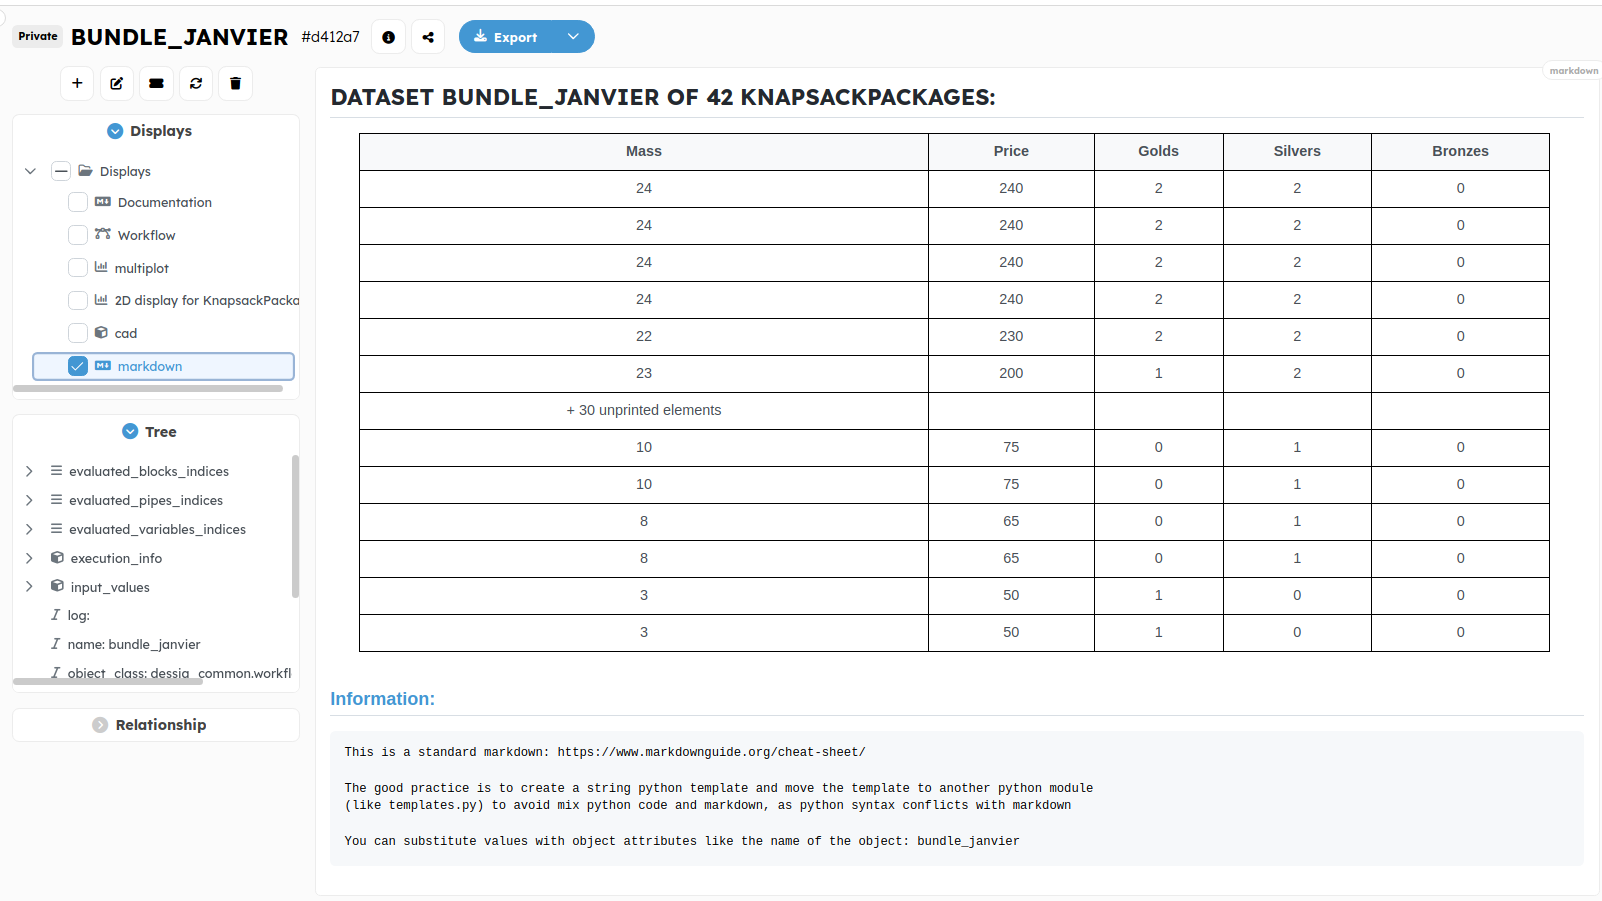
Markdown: We will add the markdown on the output of the block named
DATASET. This block contains all the solutions and is represented by the
class named DataSet. By clicking on Add Block and then Markdown, a new
window opens at the right which allows you to fill in a few fields.
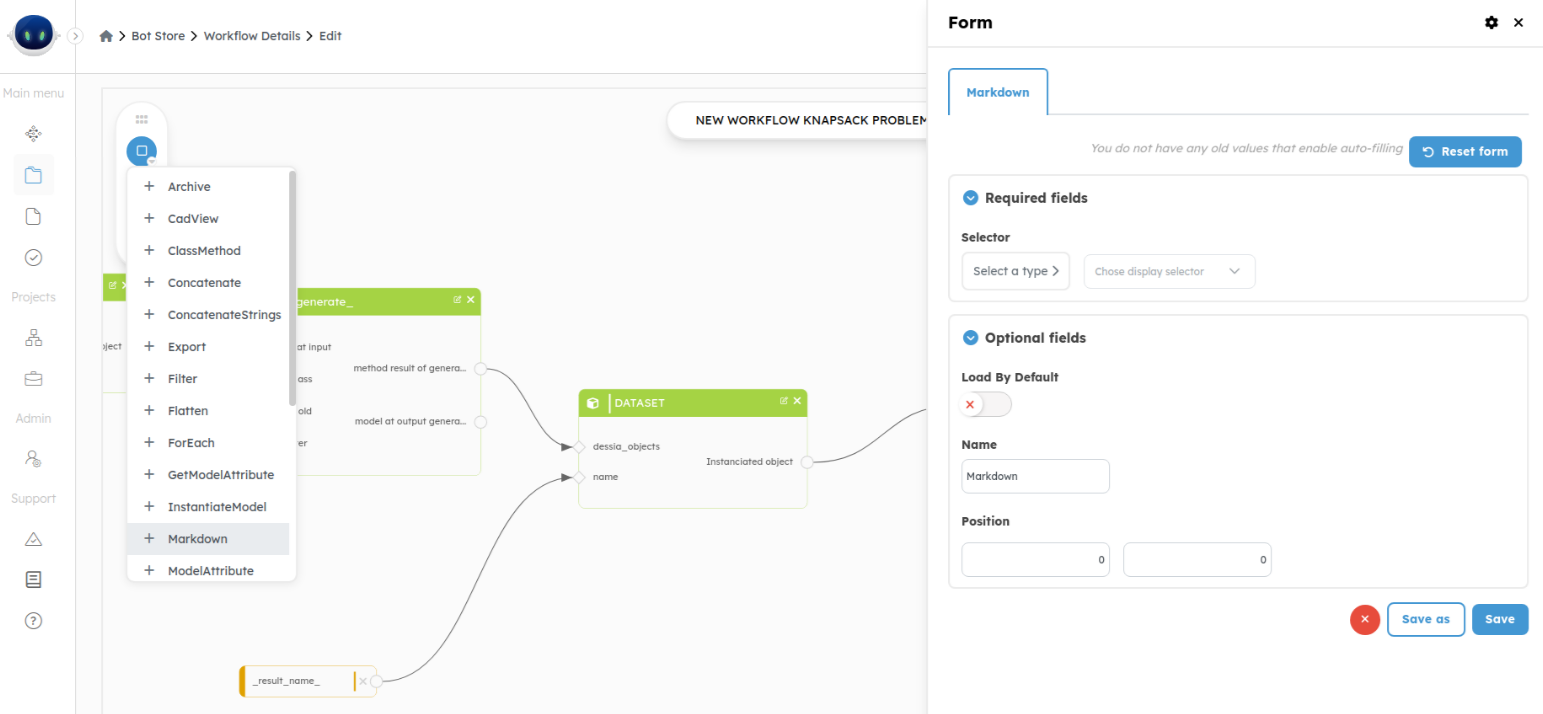
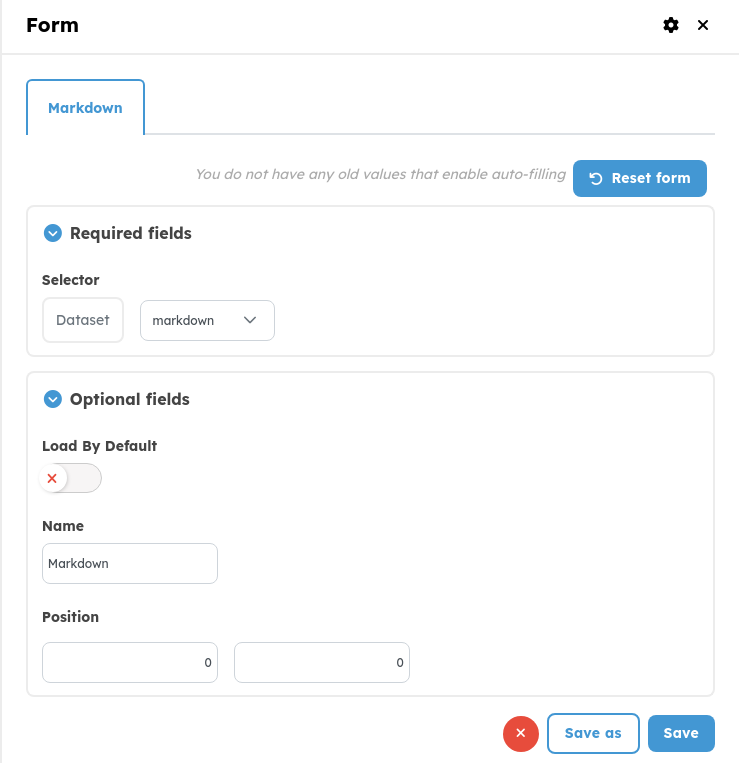
In the new window that opens, you need to configure your block.
- Reset form: This allows you to go back by deleting the filled fields.
- Selector: Decorator that identifies the display (in case of markdown and cad view, we have just one selector by default, but plot_data it’s different). Selctor it’s what appears in
Displayspanel of object, in this caseWorkflowRun. The first field represents theclassand the second represents the name of theselectorthat you put on the decorator of your method. - Load By Default: Parameter to define if you want the display to be loaded by default (displayed) or not, on the
WorkflowRunpage. - Close: This closes the form.
- Save: This allows you to save the new block and have it in your workflow.
- Name: This represents the name of your block.
- Position: This represents the position of the blocks in the workflow.
By clicking on Save, the block will be added to your workflow and you just
have to attach its input to the output of the previous block.
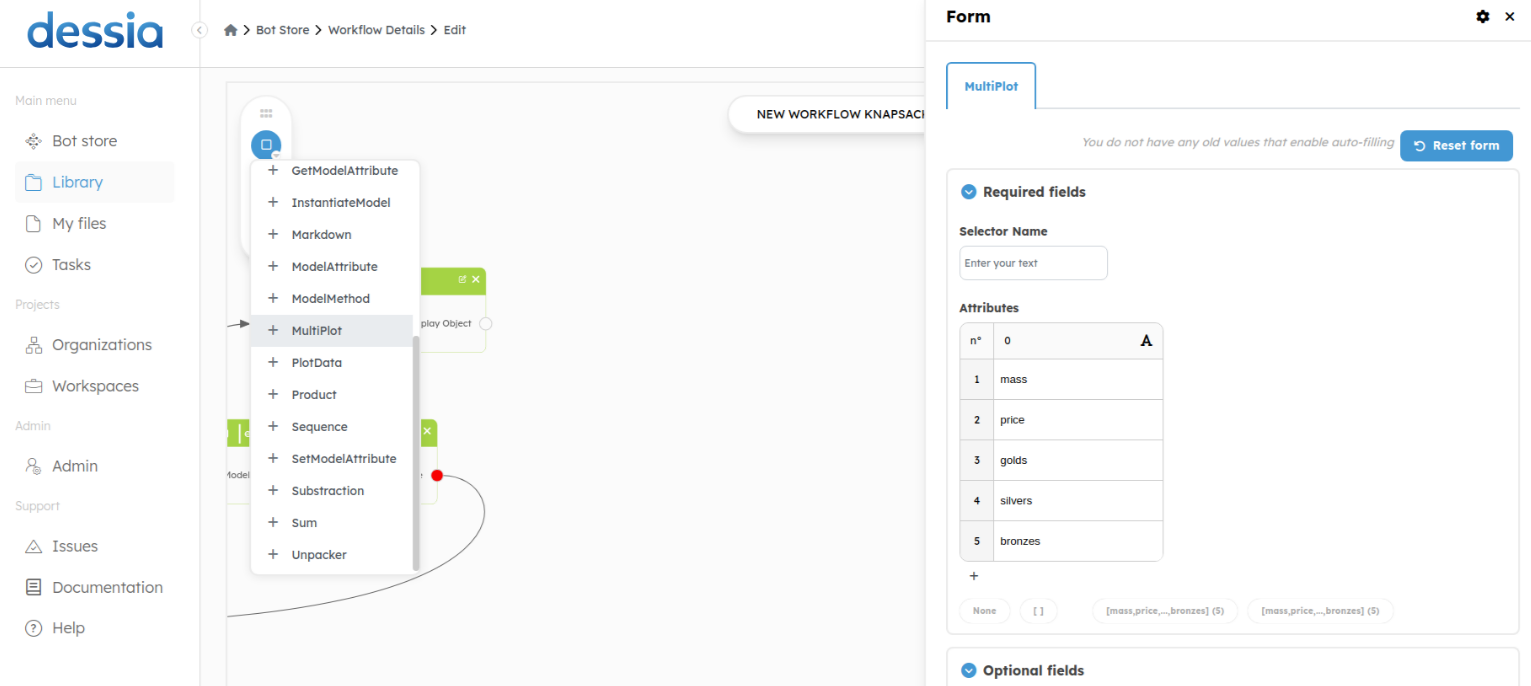
Multiplot: We will add the multiplot on the output of the block named "extract". This block contains all the solutions and is represented by a list. The multiplot block has as input a list of objects to make a graph that represents the relationship between the data of your objects.
- Selector Name: The name that appears in
Displayspanel of object, in this caseWorkflowRun - Attributes: This represents the attribute list of your object (an object
from your list output) in this example, the attribute list of an object from
the list output from the block named
extract. In other words, it represents the characteristics of the object (e.g. length, width, mass...).
Once all the fields are filled, we save and we link the input of the new block, in this case, it is a list of objects.
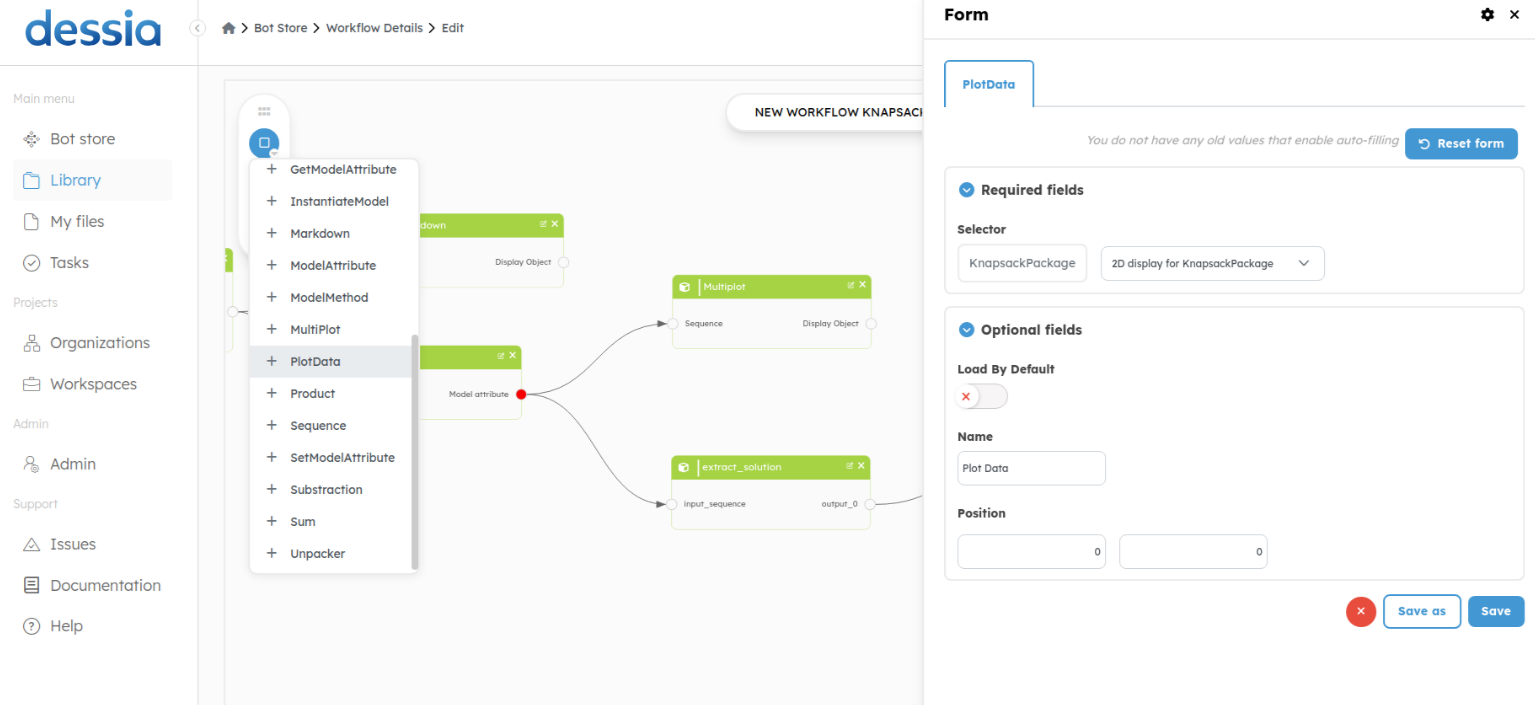
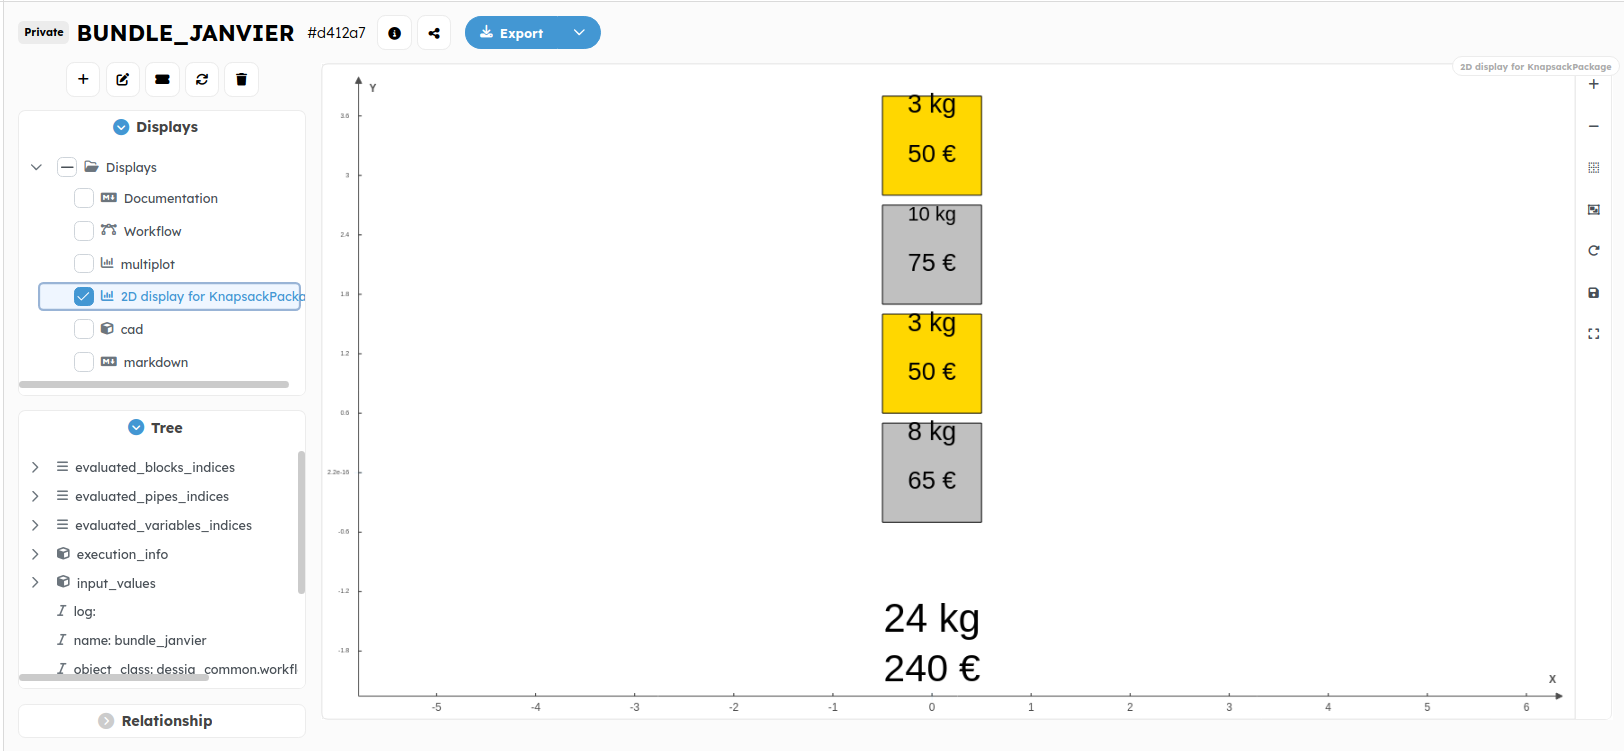
Plot_data: In this part of documentation we take an example of plot_data type 2d view , it’s the same with Multiplot, just the first should return PrimitiveGroup and the secont MultiPlot .
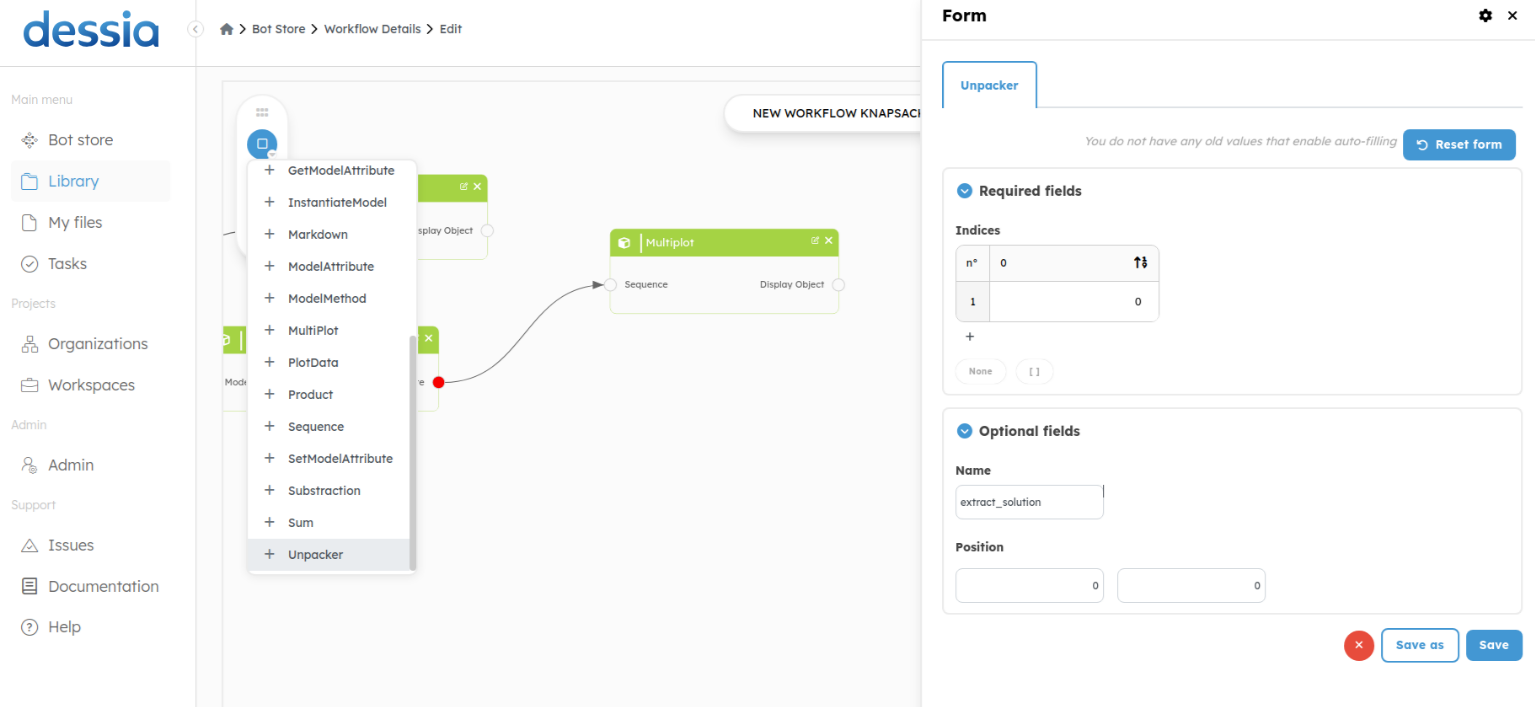
At the output of our workflow, we have a list of objects. For this, we will extract a solution from this list using the Unpacker block. Then we will add the block plot_data.
For this example, we take the first solution (the index 0 of our output list).
Here is the implemented method.
@plot_data_view("2D display for KnapsackPackage")
def display_2d(self):
primitives = []
y_offset = 0
for item in self.items:
primitive_groups = item.display_2d(y_offset=y_offset)
primitives.extend(primitive_groups.primitives)
y_offset += 1.1
text_style = TextStyle(text_color='rgb(0, 0, 0)',
font_size=None,
text_align_x='center',
text_align_y='middle')
primitive1 = Text(comment=f'{self.mass} kg',
position_x=0,
position_y=-1.5,
text_style=text_style,
text_scaling=True,
max_width=1,
multi_lines=False)
primitive2 = Text(comment=f'{self.price} €',
position_x=0,
position_y=-2,
text_style=text_style,
text_scaling=True,
max_width=1,
multi_lines=False)
primitives.extend([primitive1, primitive2])
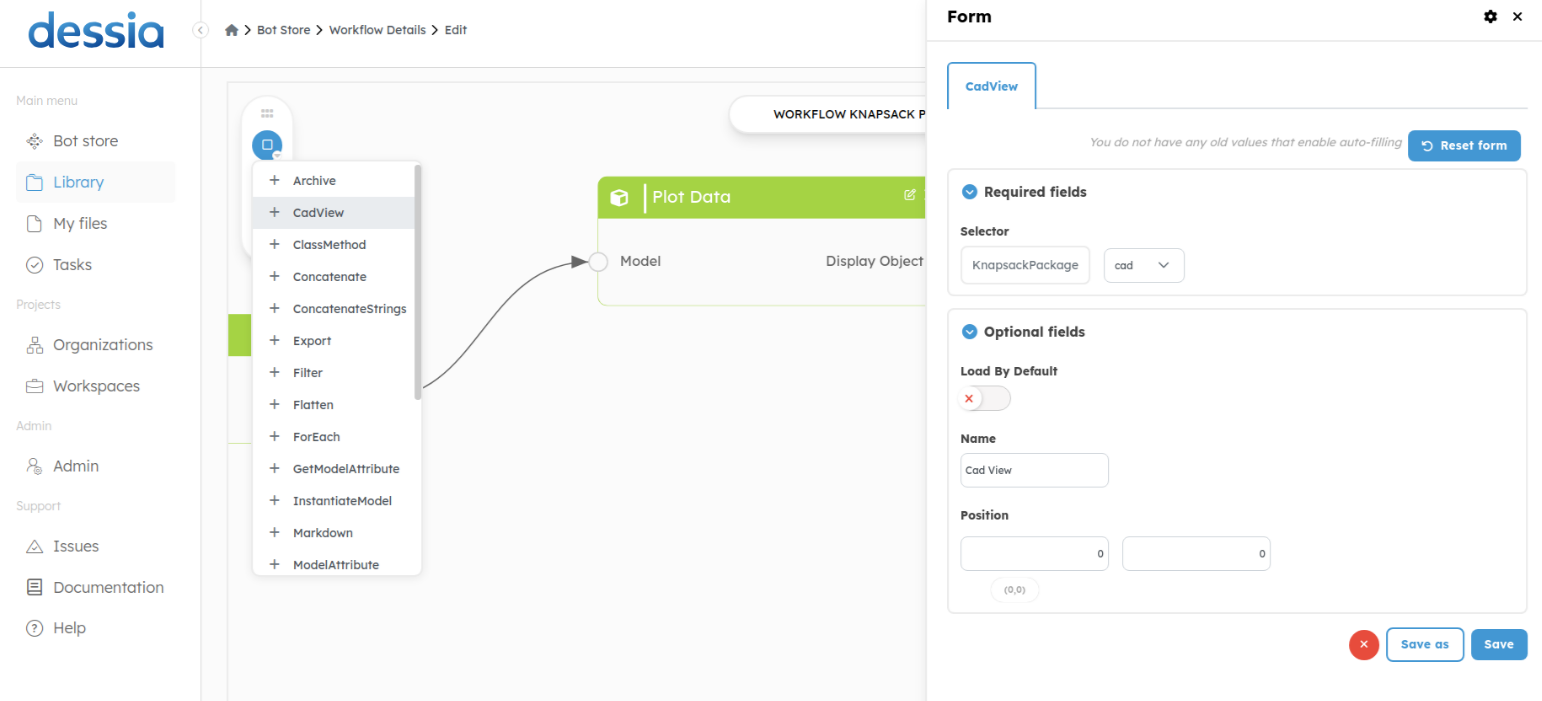
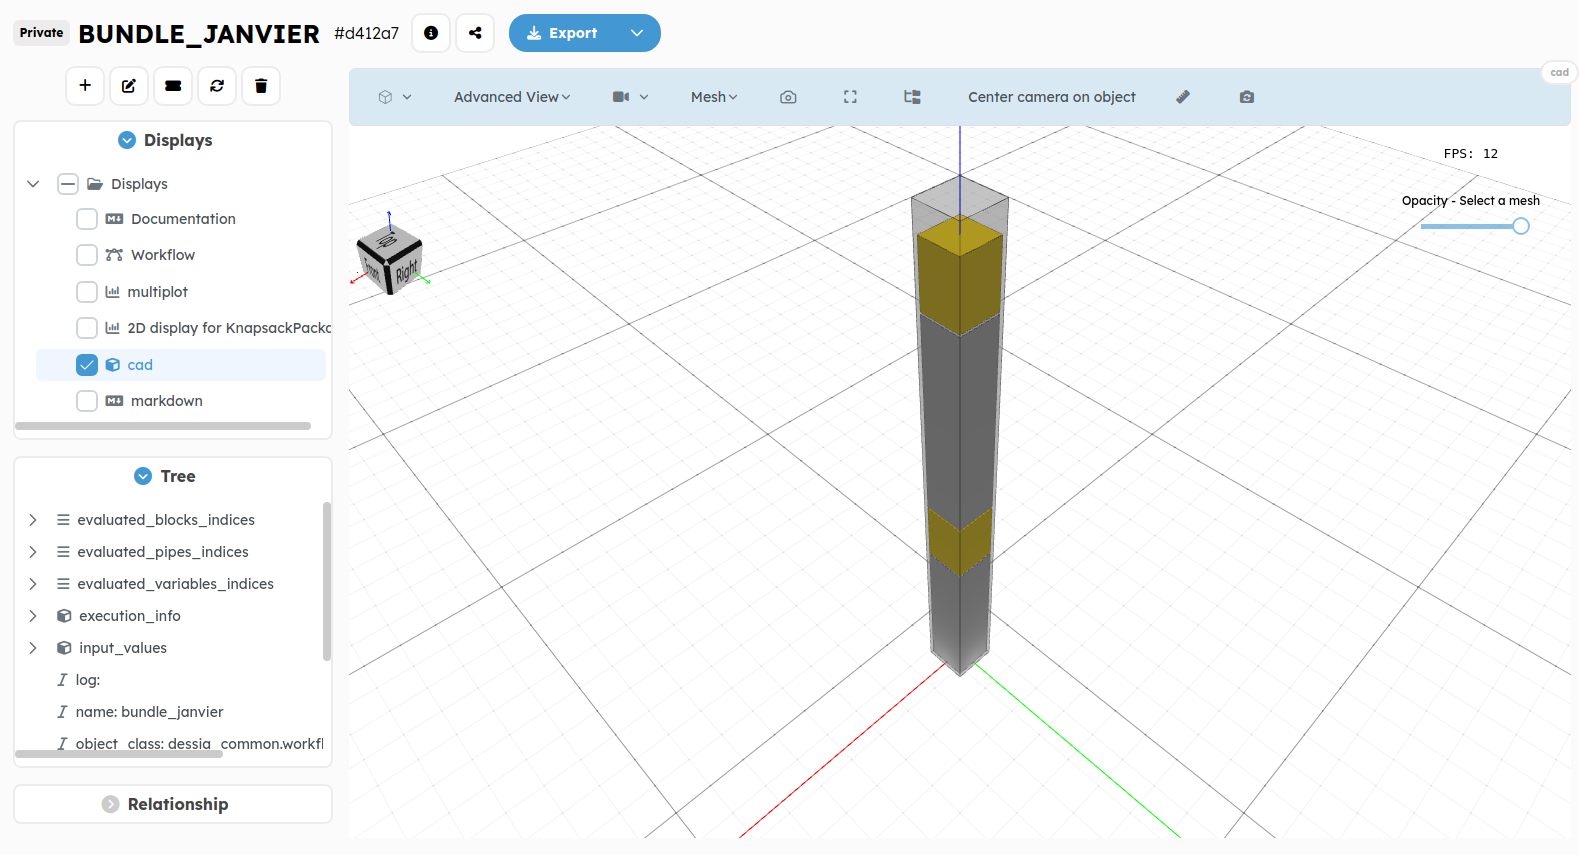
return PrimitiveGroup(primitives=primitives)Cadview: This block allows the representation of an object in 3D view. We
will present the 3D view of the first object of the output list. The cadview
block does not require parameters in its input (like Markdown or plot_data).
It depends on what function you have programmed for your object.
This is what the new version of the workflow looks like after adding the display blocks. You just have to launch it to see the result after adding the display blocks.
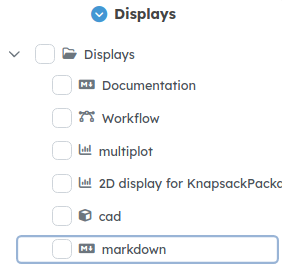
3. Displays in the WorkflowRun page
After launching your new workflow, you open the results page. On this page, you will see the names of your display selectors appear in the section named DISPLAYS. The first two displays are default. They represent the workflow documentation and the workflow graph representation, respectively. By checking the desired box, the display is shown. You can also display all by checking the very first box.
Markdown:
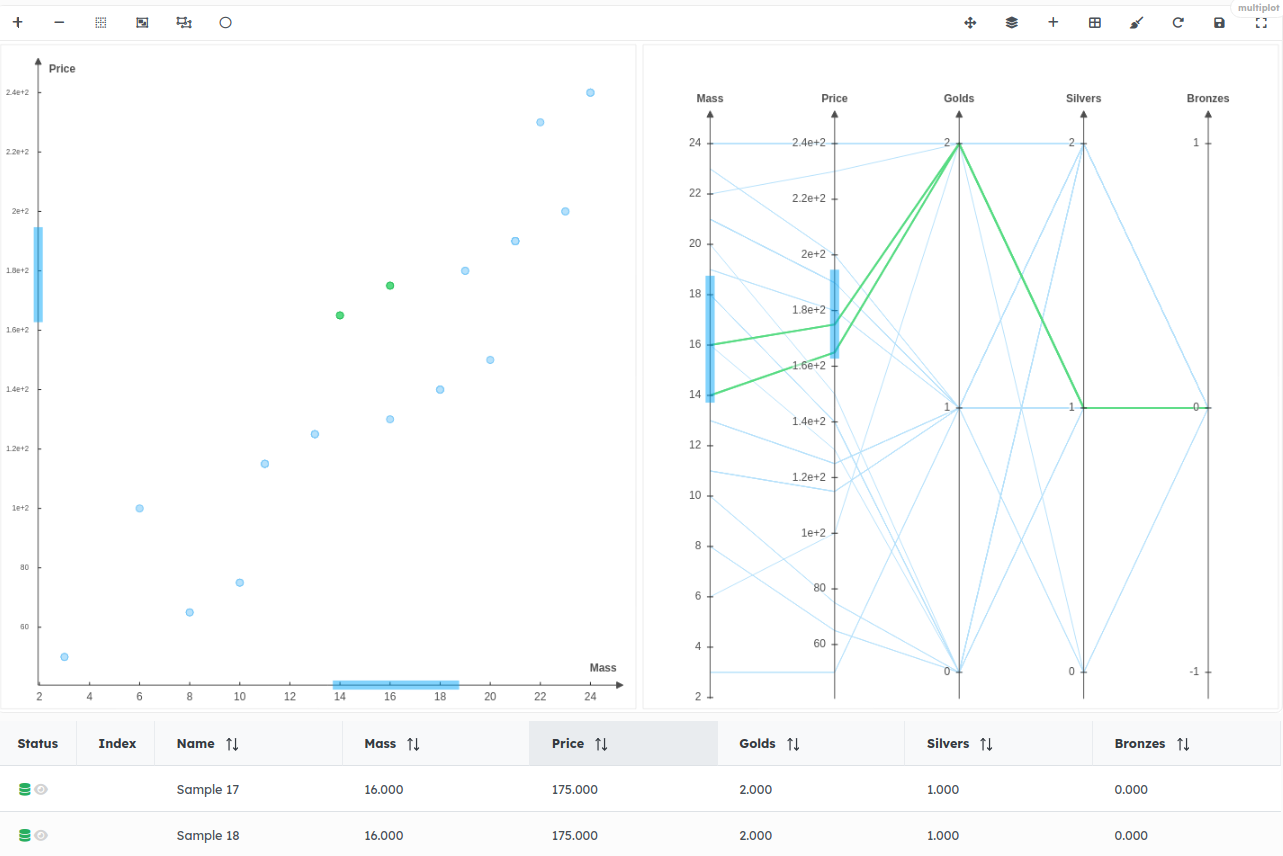
Multiplot:
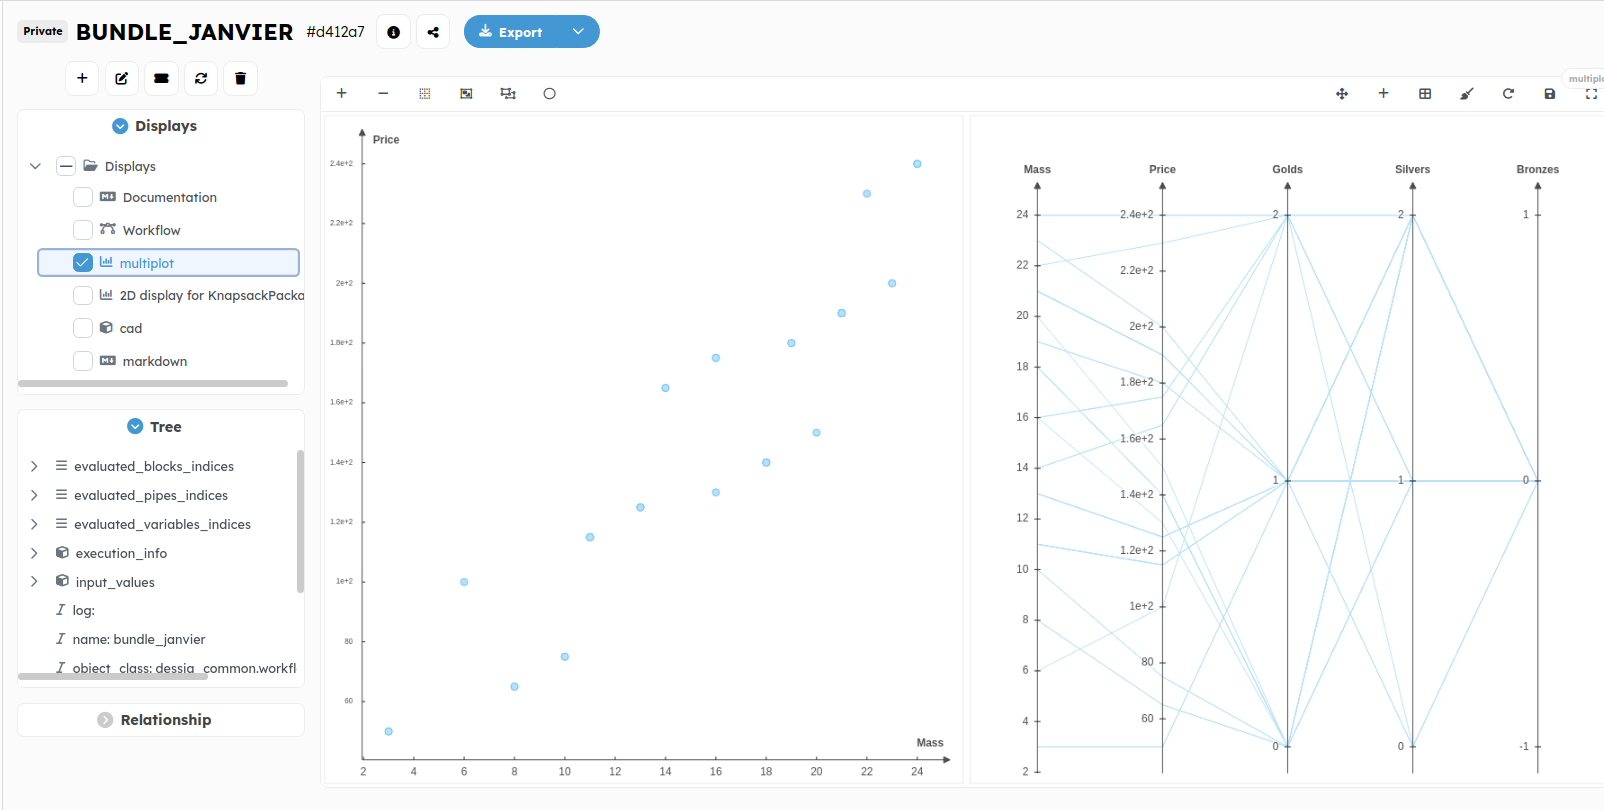
Note that the displayed solution for this workflow in plot_data and cadview is random. If you want to visualize another solution, you can select many solutions in multiplot axes and then click to display them.
Plot_data/2D view:
CAD view:
Go to the chapter Master 2D and 3D displays to learn more about display manipulation.